Enable xdebug extension on PHP Apps in Windows for Performance Scenarios
Hello, in this guide we will instruct you how to enable xdebug extension for PHP applications in Windows App Service Plan.
For PHP application running on Windows App Services Plan, we can enable xdebug extension to profile and troubleshoot the App, mostly for performance issues or scenarios
Xdebug is a PHP extension which provides debugging and profiling capabilities. It uses the DBGp debugging protocol.
The debug information that Xdebug can provide includes the following:
- Stack and function traces in error messages with:
- Full parameter display for user defined functions
- Function name, file name and line indications
- Support for member functions
- Memory allocation
- Protection for infinite recursions
Xdebug also provides:
- Profiling information for PHP scripts
- Code coverage analysis
- Capabilities to debug your scripts interactively with a debugger front-end
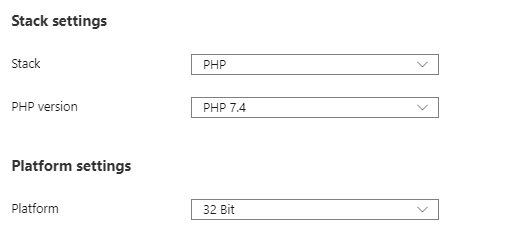
For starting we need to know if the App Service is 32 or 64 bit, also the PHP Version.
This can be gotten in your App Service Configuration> General Settings:
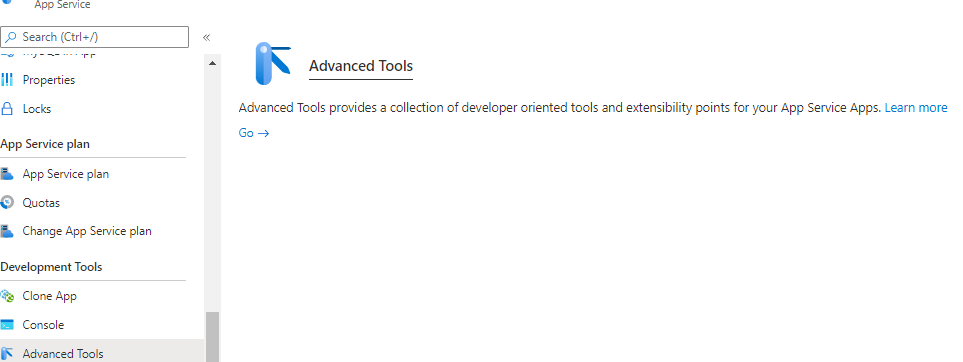
Secondly we need to go to Kudu(CSM or Advanced Tools)> Debug Console> CMD:

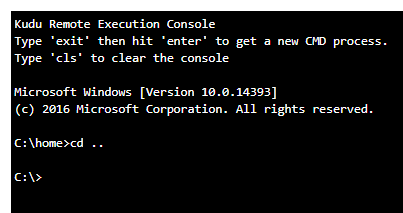
In the command prompt we type the following command since the command prompts indicate us we are in “C:\home> “
| Command: |
| cd .. |
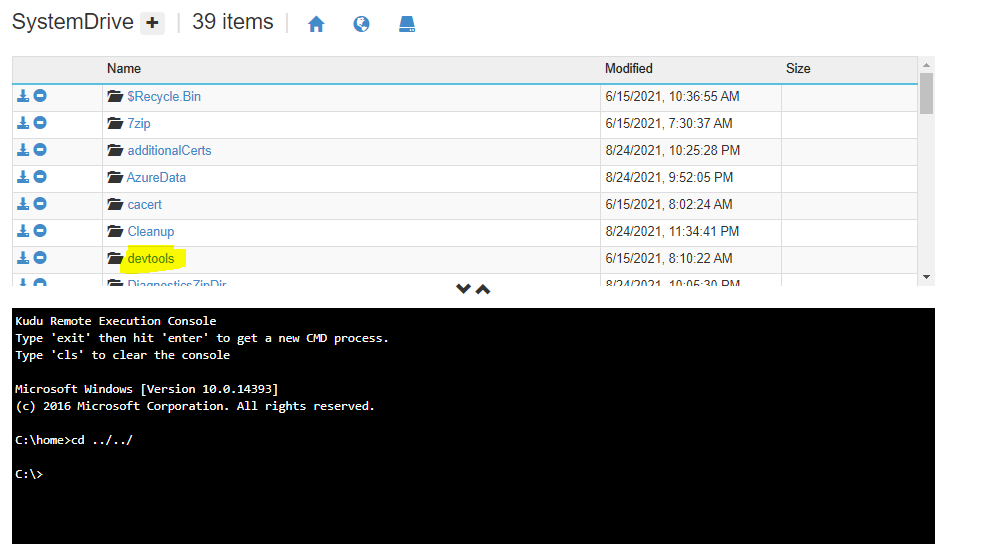
Once the command is ran, we will be able to see a directory listed, let’s click on “devtools”
Then we click on xdebug, this will display us a directory with folder named with the xdebug version available:

In here we click on the desired version of xdebug you want to use, in my case 2.9.5:

When this folder is click it will show you the PHP version compatible with the selected xdebug version:
In my case I am using php_7.4

When we click in the folder, it will be displayed two DLL’s files, one for being ran on 64-bits and another for 32bits(usually marked as x86)
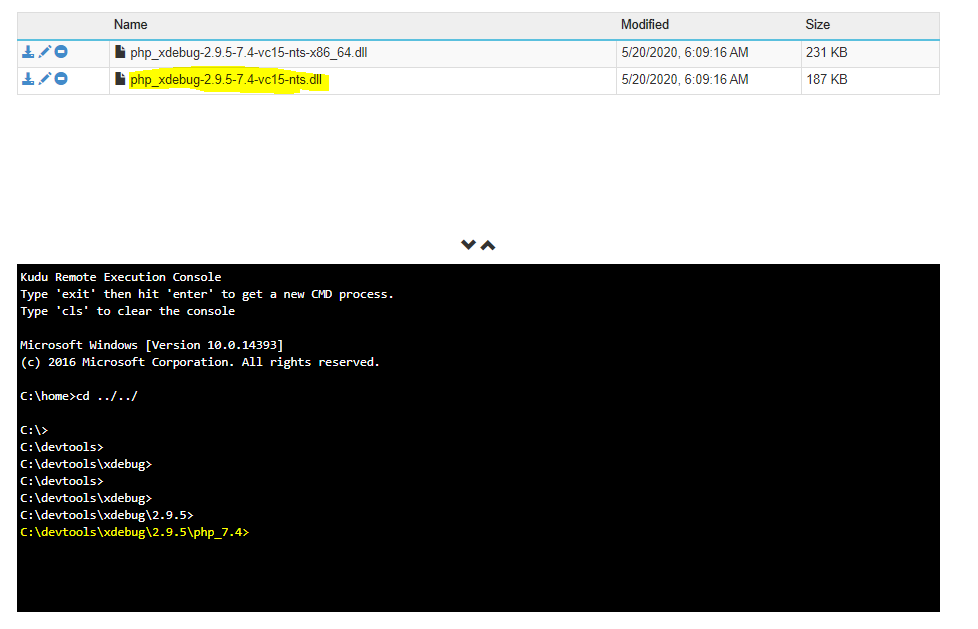
Now in here, we copy in notepad, the yellow highlighted text as following:
“<path-to-the-folder-of-the-desired-version-of -xdebug>\<name-of-the executable-dll-of-xdebug-you-want-to-use(32-bit-or-64-bits)”
In my case:
“C:\devtools\xdebug\2.9.5\php_7.4\php_xdebug-2.9.5-7.4-vc15-nts.dll”
Now we click again in Debug Console> CMD, to take to again to the path “C:\home\site>”
In wwwroot, should be an file called “.user.ini” or “<any-name>.ini”, let’s click on the pencil of that file to edit it, if you don’t have this file please create one called “.user.ini”, and edit it

In there we could have some settings like “log_errors = on” that enables us to see code errors when rendering a site
At the end of those settings, please add the following:
| Setting for enabling xdebug in PHP 7.4 Windows App Service | Detail |
| log_errors = on . . (settings that could be already set in this file) . . zend_extension= “C:\devtools\xdebug\2.9.5\php_7.4\php_xdebug-2.9.5-7.4-vc15-nts.dll” xdebug.profiler_enable=0 xdebug.profiler_output_dir=”D:\home\site\wwwroot\bin\xdebug_profiles” xdebug.profiler_enable_trigger=1 | The highlighted line between quotes, was the line we generated in a notepad in the previous step for choosing the desired executable dll you need(32bit or 64-bits) “<path-to-the-folder-of-the-desired-version-of -xdebug>\<name-of-the executable-dll-of-xdebug-you-want-to-use(32-bit-or-64-bits)” In my case: “C:\devtools\xdebug\2.9.5\php_7.4\php_xdebug-2.9.5-7.4-vc15-nts.dll” Do not delete this string path yet, we will need it later. |
Example:

Now we click on save, and it will return you back to the wwwroot directory.
In here please run the following commands:
| Commands |
| mkdir bin cd bin mkdir xdebug_profiles cd ../../ |
After this is done we can close Kudu(CSM or Advanced Tools)
Now we need to add the following App Setting in your App Service> Configuration> Add App Setting:
| Name: | PHP_ZENDEXTENSIONS | Details Below |
| Value: | C:\devtools\xdebug\2.9.5\php_7.4\php_xdebug-2.9.5-7.4-vc15-nts.dll | The value of here is as the line we generated in a notepad in the previous step for choosing the desired executable dll you need(32bit or 64-bits) <path-to-the-folder-of-the-desired-version-of -xdebug>\<name-of-the executable-dll-of-xdebug-you-want-to-use(32-bit-or-64-bits) Make sure to paste it WITHOUT QOUTES, this is my case : C:\devtools\xdebug\2.9.5\php_7.4\php_xdebug-2.9.5-7.4-vc15-nts.dll |

Now we can click and save, and continue. After that please restart your App manually:

Now let’s restart the App Service

***IMPORTANT***
Once this is done, we can trigger the xdebug by making a simple request:
For example:
<your app url>/<name-of-file.php>?XDEBUG_PROFILE=1
In my case I will use two sites:
The query parameter ?XDEBUG_PROFILE=1 triggers the xdebug profiler.
***IMPORTANT***
For watching the results of it we have to go to the path in the App Service :
C:\home\site\wwwroot\bin\xdebug_profiles to see the profiler traces
For doing getting there, we can use FTP(Secured preferable), or you can go back to Kudu(CSM or Advanced Tools) to see them:
In my case I will use Kudu:
I went to C:\home\site\wwwroot\bin\xdebug_profiles>, and there are the two files
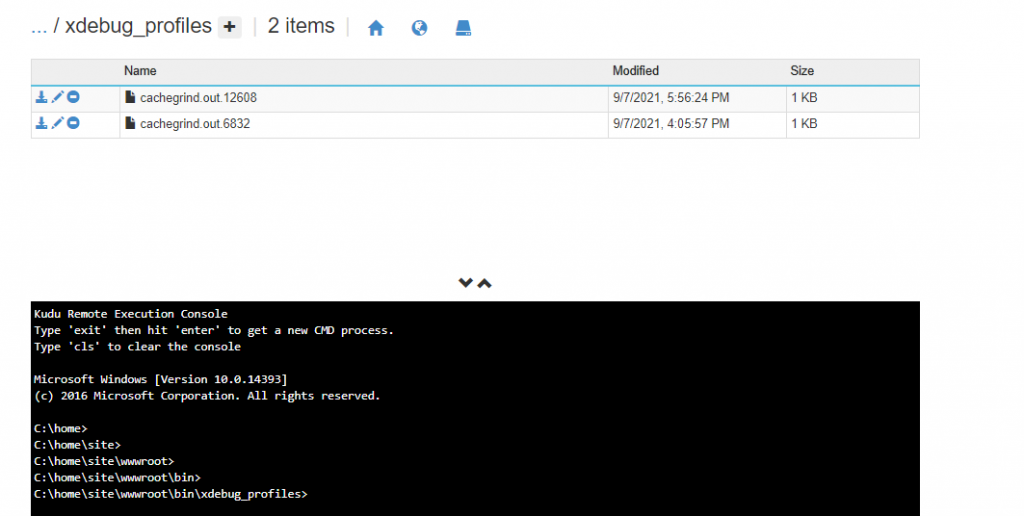
We can edit them or download them to see them, let’s take a look by click on the “Pencil” button for editing:
For info.php or https://dagophp.azurewebsites.net/info.php?XDEBUG_PROFILE=1, this is the file trace
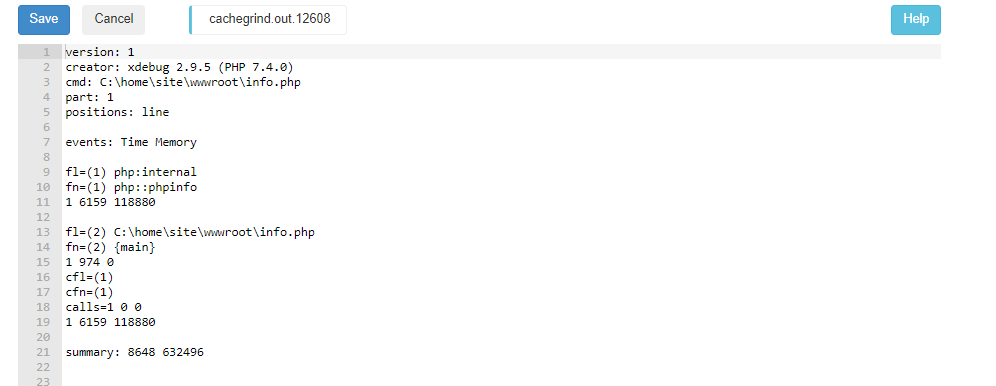
For index.php or https://dagophp.azurewebsites.net/info.php?XDEBUG_PROFILE=1, this is the file trace:

With that done, now you have configured xdebug extension for profiling your PHP Application.
If you have any further questions or concerns, please feel free to contact me. I am always glad to advise!
Thanks for reading my blog 🙂
Dorian Isaac Vallecillo Calderón
LinkedIn Profile: https://www.linkedin.com/in/dorianivc/
Email: dorianivc1@gmail.com

